Eye-Catching Data Visualization
Customizable Infographics to capture capture the attention of your audience.
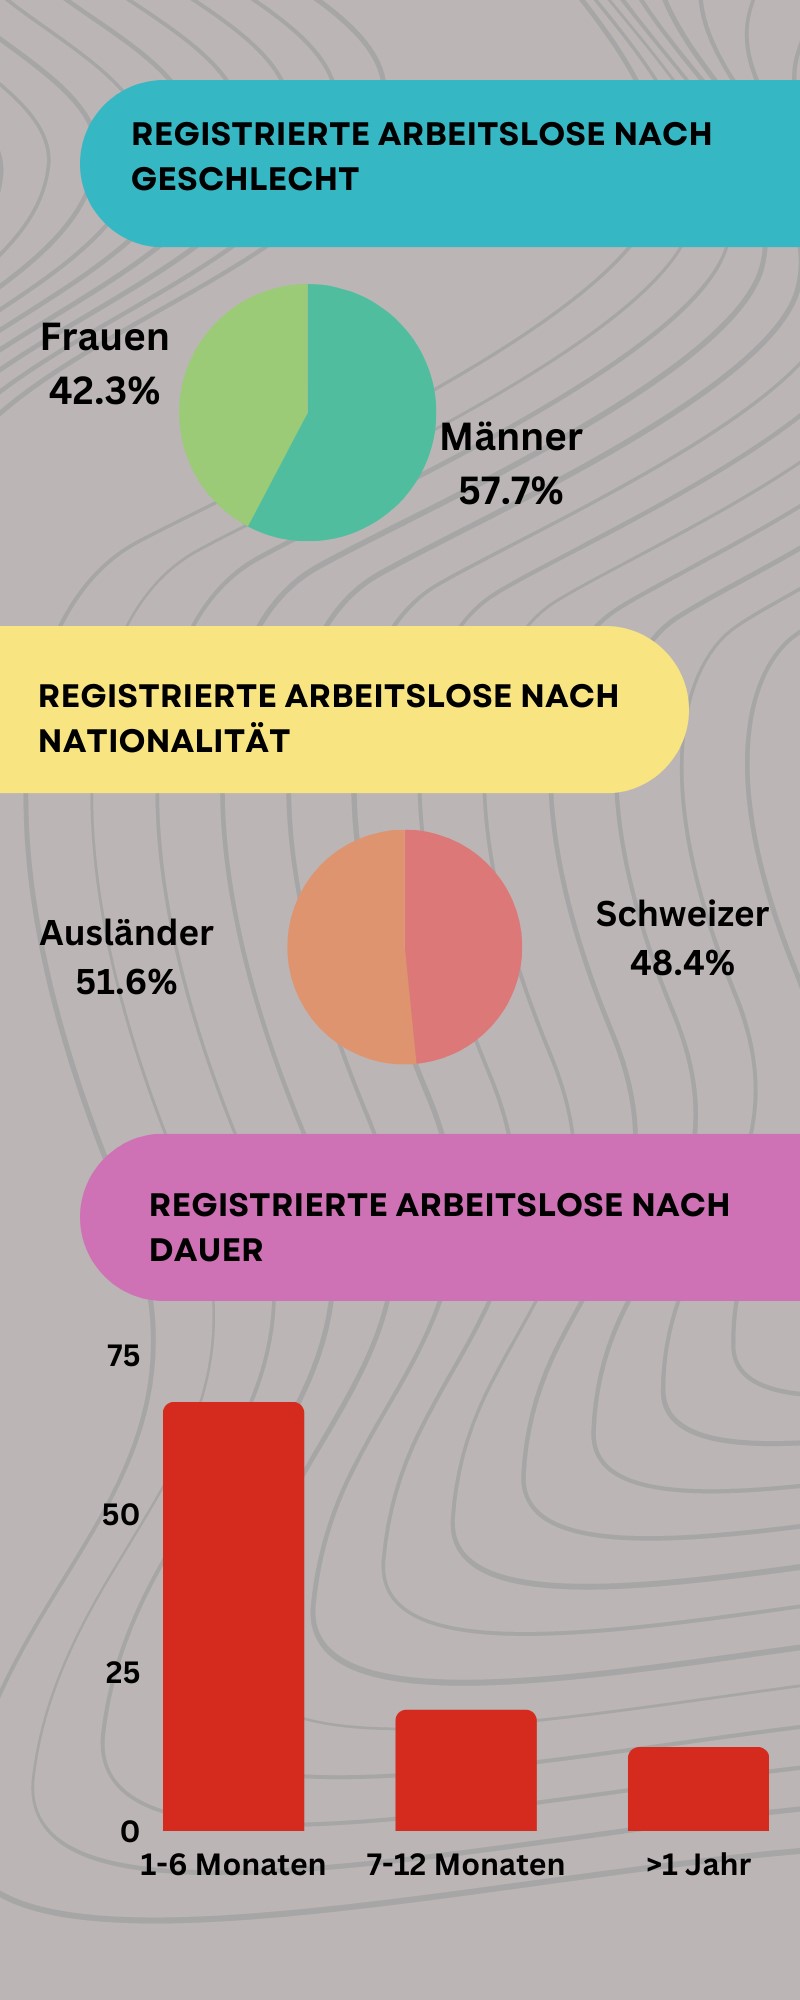
Infographics can help people understand complex concepts by using visual aids such as charts, graphs, or diagrams. They can use both images and text in a visual format to explain concepts.
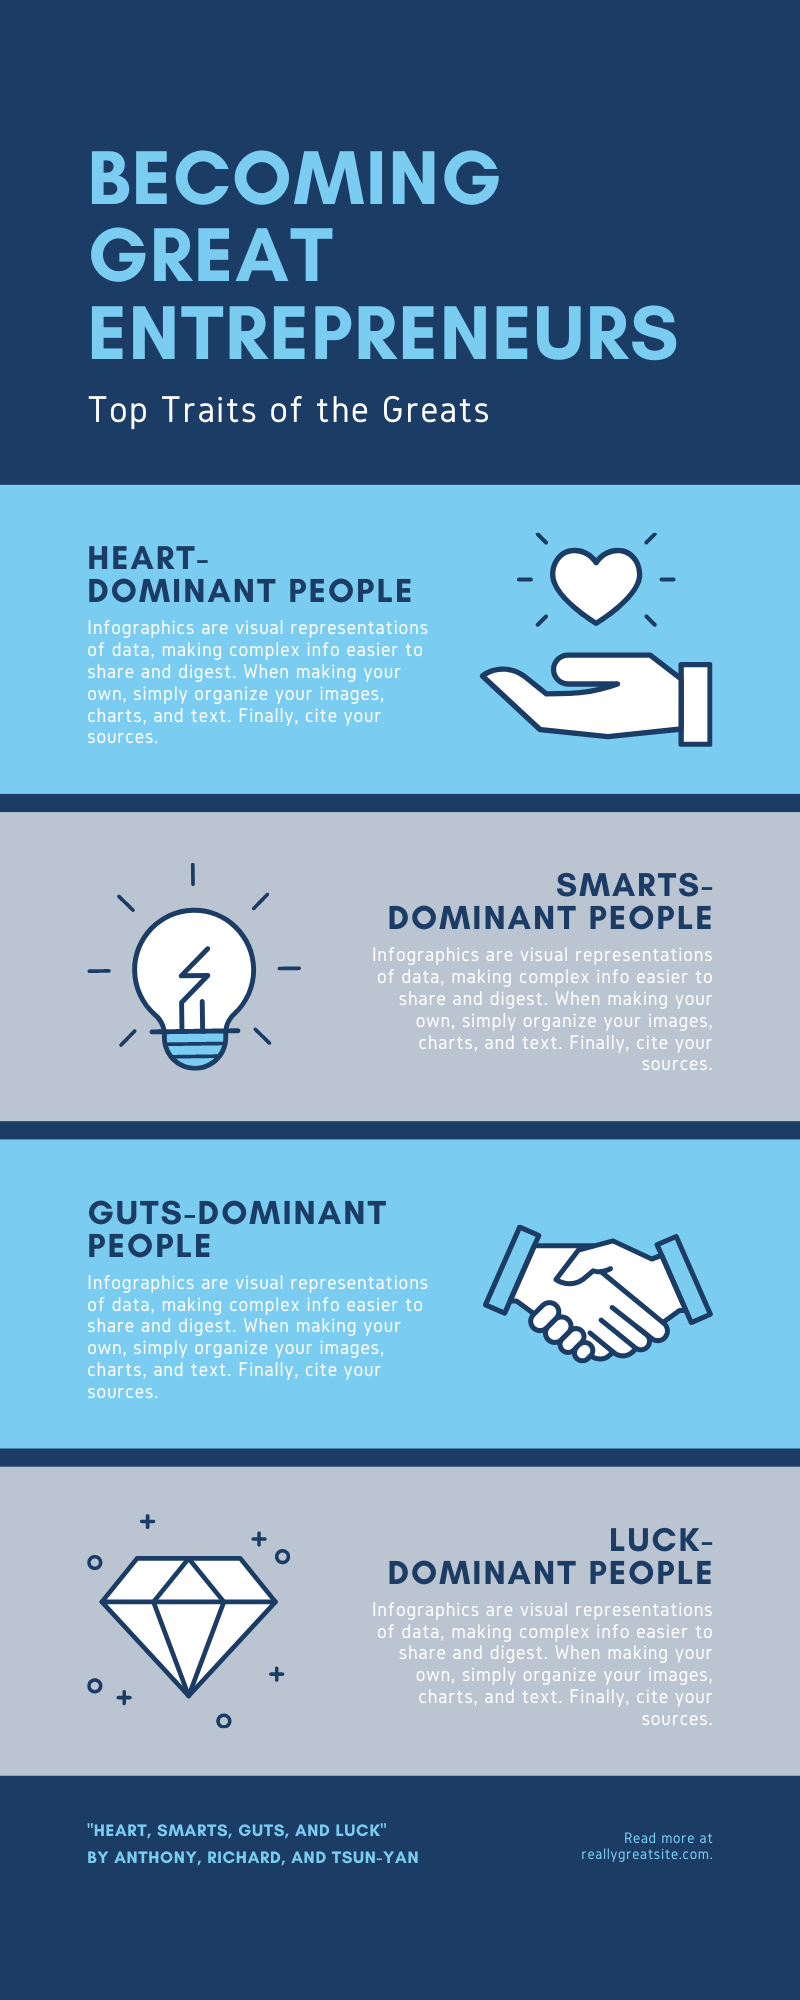
As data becomes more and more a part of how we understand our world and our work in it, data visualization and infographics are becoming more commonly used words that refer to how we learn about and share this data with others.
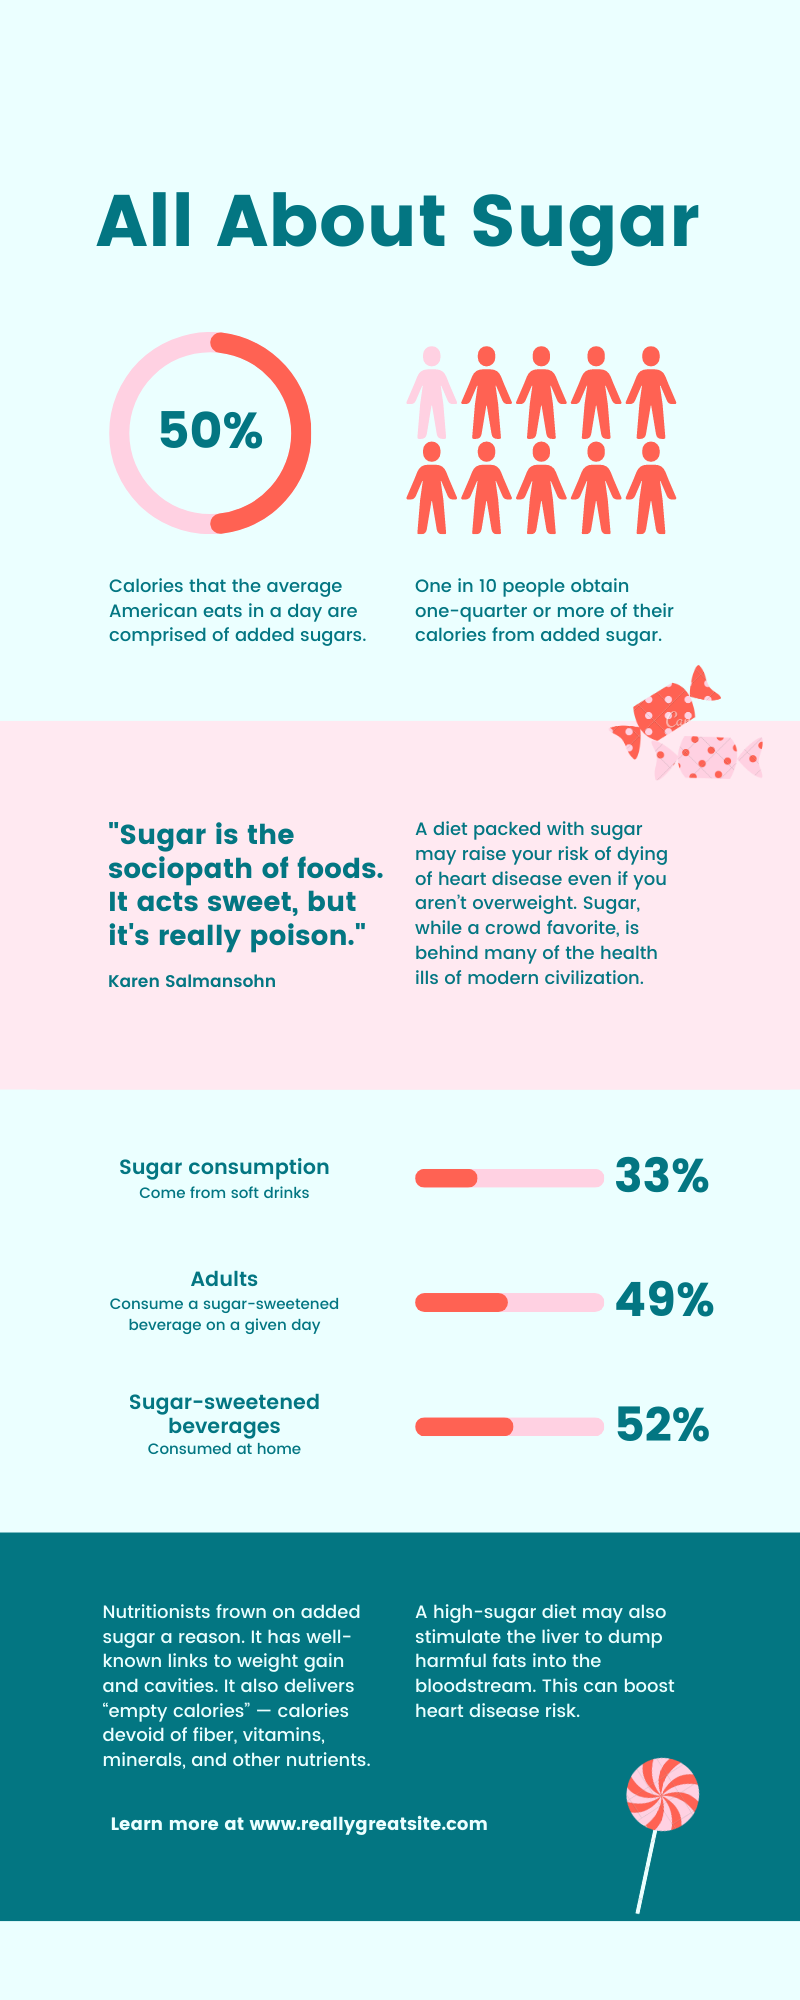
Infographics have become increasingly popular because of their ability to quickly convey large amounts of information in an appealing package.
People use infographics to quickly communicate a message, simplify the presentation of large amounts of data, see data patterns and relationships, and monitor changes in variables.